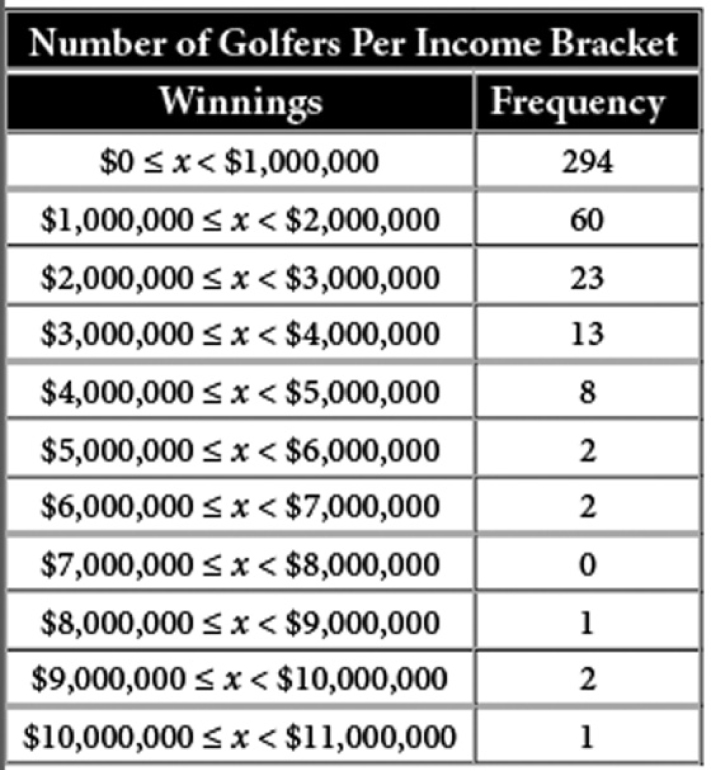
Yes, it’s called Lotka’s Law. We observe that human characteristics like lifespan, height, and IQ are bound closely to the average, so that 95% of American males are within 10% of the average height. Similarly, 95% of Americans have an IQ that is within 30 IQ points of the average American IQ. These attributes are said to have a normal or “Gaussian” distribution that can be represented by a “bell curve.” However, wealth, human accomplishment and productivity, unlike the attributes described above, deviate more dramatically from the mean at the extremes. The graph below shows the distribution of winnings of golfers on the PGA Tour in 2017.

In that year, the total winnings on the PGA Tour were about $360 million and the mean winnings were about $0.9 million and the standard deviation was about $1.4 million. If the winnings were normally distributed, only 0.13% of the 406 golfers, fewer than one, would be expected to win an amount more than 3 standard deviations above the mean winnings (i.e., above $5.1 million). However, 8 golfers exceeded that amount. Furthermore, the top 20% of the money winners actually earned about $248 million–almost 70% of the total–not 80%, but reasonably close to that predicted by the 80–20 Pareto principle. Why are the winnings so strongly skewed to those at the top? In the absence of experience with statistical distributions, a person might be inclined to draw a visceral inference, declaring, “it’s not fair,” or “it’s rigged.” Before explaining why this happens, we’ll take a brief mathematical digression, taken from the book Intelligence https://www.intelligence-and-iq.com/intelligence/
In the case of the PGA Tour, it is reasonable to expect that the proportion of golfers p(x) who reach winnings of $x is inversely proportional to x; that is, as x increases, the proportion of golfers winning $x decreases, i.e., p(x) = kx–1. Taking the natural logarithm of both sides of this equation yields: log p(x) = –log x + log k, indicating that log p(x) varies partially with log x. This relationship can be made less stringent by writing log p(x) = –alog x + b where a and b are parameters that can be estimated by using any available data. That is, log p(x) = log x–a + b. Raising both sides of this equation to the base e yields: p(x) = Cx–a, where C is a constant. That is, p(x) is a power function of x and its graph is known as a Lotka curve.
The tail of a distribution defined by a power function approaches 0 more slowly than the tail of a normal distribution as the distance from the mean value is increased. For example, from the PGA data, we observe that the top 4 golfers, representing 1% of the players, had more than 10% of the total winnings. This is similar to the distribution of income in America whereby the top 1% of income earners account for 10 to 20% of the total income pool. This means that while human characteristics like lifespan, height, and IQ are bound closely to the mean, human accomplishment and productivity deviate more dramatically from the mean at the extremes.
Why do the distributions of human productivity, income, and wealth follow a Lotka rather than a Gaussian Distribution?
Suppose becoming a theoretical physicist requires an IQ of at least 130. Then consider a theoretical physicist who has an inventiveness that surpasses 90% of his or her colleagues. Now, imagine a person in that rarified group possessed with a passion and tenacity that exceeds 90% of the people who satisfy the first two criteria. That person is about 1 in 5000 or from the top 0.02% of the human population–much rarer than the 1 in 44 people with an IQ of at least 130. In other words, achievement requires a host of rare human qualities along with the luck of opportunity making it extremely rare. As Charles Murray observed in his book Human Accomplishment:
When you assemble the human résumé, only a few thousand people stand apart from the rest. Among them, the people who are indispensable to the story of human accomplishment number in the hundreds. Among those hundreds, a handful stand conspicuously above everyone else.
The distribution of attributes among humans is unequal, while the concept of “fair” is a human construct.
